Loading...
Loading...
Loading...
| Today | |
| Total: 0 | |
Click on a link to load a selected example repository:
This project was originally created for the Third Annual Github Data Challenge and targets repository issues. The site has since been rewritten — the current version is a rebuild that improves data collection, performance, and the UI while keeping the original intent: visualizing repository issue history.
Bug-life is a visualization of repository issues from 2 perspectives:
The data is collected using the GitHub GraphQL API, which provides a more efficient and flexible way to fetch issues and related data than the older REST endpoints. It includes:
The top graph shows the number of labels of open issues at a
specific date. It also presents the usage of issues and labels
during the lifetime of the repo. Only current issue labels are
shown, i.e. the unlabeled/labeled events are not tracked. Each label
represents one unit, hence it gives an overview of the generic
status of the project. For example, if there are many open issues
with enhancement or feature labels, then
most probably the team is working on a new version. If there are
many bug and documentation labels, then
the team is getting ready for a new release. It might be seen that
some projects have no issues at all or are not using labels.
The bottom graph shows the lifespan of issues. The bigger the semicircle radius, the longer it takes to close an issue. If the end point of the semicircle is not visible on the graph, then the issue is still open. Each open/close event is visible on the graph. The color of the issue is set by the issue label. This is a good representation to determine old pending issues and view project agility.
For unauthenticated requests, Github sets a requests rate limit up to 60 requests per hour. In case the number of requests to collect data is bigger than the rate limit you'll have to authenticate yourself via Github OAuth and authorize our application. After authorization your requests rate limit will be 5,000 requests per hour. Enjoy :)
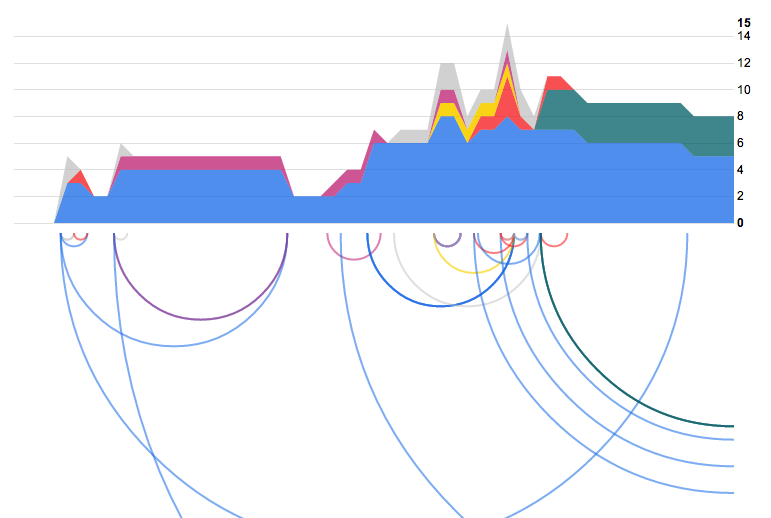
From the top graph it is seen that the repo contains mostly labeled issues, thus the maintainers keep track of different types of issues. There are few bugs and mostly feature requests. From the below graph - about half of issues have short lifespan. Feature requests require more time to be implemented and closed. As well, feature requests make out the main part of open issues at the moment.
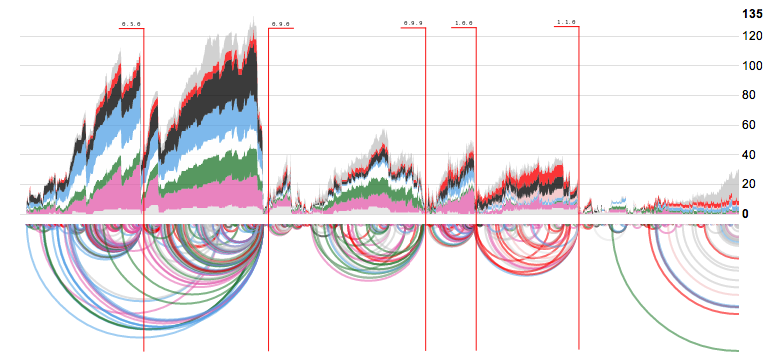
This is a popular repo on github - backbone. It has a rich history, well organized labels and release cycles. On version 0.9.0, when backbone reached a relatively stable state, many issues were closed. Before this release there were other important ones, for example 0.5.0.
After 0.9.0 backbone lived through 3 other important milestones:
0.9.9, 1.0.0 and 1.1.0. Each of these releases was focused on
different aspects. Right before version 0.9.9 most open issues were
of type change, while before version 1.1.0 most open
issues were of type bug.
Do you want to showcase your own example here? Create a pull request.